
High-Power Prototype Thermal Validation Platform|P-001
P-001 is Hyper Cool Lab’s bench-scale thermal-validation platform for creating traceable, comparable physical evidence under defined thermal, mounting, and cooling conditions.
The central question is not simply:
“What parameters can the platform measure?”
Nor is it only:
“Can this device be cooled?”
The real question is:
Under a known thermal load, a defined installation boundary, and controlled cooling conditions, what thermal and hydraulic response does the test article actually show, which boundary may be limiting the result, and is the evidence sufficient to support the next engineering decision?
P-001 v0.1 has completed Formal Measurement Release.
Within its current released boundary, P-001 supports:
Engineering Validation under Stated Conditions
The platform turns an engineering question into:
Controlled boundary → Physical measurement → Comparable evidence → Engineering decision
The objective is not to extend one measured number beyond the conditions that produced it.
1. What P-001 Is
P-001 is Hyper Cool Lab’s configurable, instrumented bench-scale thermal-validation platform.
It is not a single-purpose tester with a fixed list of measurements. The configuration is built around the engineering question.
Depending on project scope, that may mean:
- establishing a known thermal load;
- defining coolant and mounting conditions;
- configuring a project-specific fixture;
- selecting the measurements needed to support the decision.
P-001 v0.1 currently uses an MCR group to record the following channels at 0.1 s intervals:
- Tin
- Tout
- Tcase
- Flow
- ΔP
- Clamp / Load
Heater V/I is logged separately from the power supply (PSW) through the PC with retained timestamps. Formal steady-state analysis aligns the MCR and PSW data streams through a common averaging window.
The objective is not to preserve only the final steady-state number. P-001 preserves how the boundary and the physical response evolve over time.
P001 is the platform used to create evidence. The platform itself is not the evidence.
What matters is whether:
- the boundary conditions are known;
- the measurements are credible;
- the conclusion remains within what the test actually supports.
2. What Can Be Put Under Test?
P-001 is not tied to one product category.
The relevant question is whether the engineering problem can be represented within a clear bench-scale thermal, installation, and cooling boundary.
Device or Cooling Assembly
The test article may be the hardware that needs to be cooled, or the cooling assembly itself—for example:
- a prototype;
- a package-representative sample;
- a cold plate;
- another compact cooling assembly.
The objective is not to assign a generic product rating.
It is to determine:
What thermal and hydraulic performance does this assembly show under the stated load and boundary conditions?
Interface & Mounting System
TIM, contact surfaces, clamp load, seating, mounting structure, and fixture geometry interact with one another.
Together, they determine:
- how the test article is mechanically loaded;
- how the interface is established;
- how heat crosses the contact boundary.
P-001 can use controlled clamp conditions, same-mount repeated measurements, and independent remount comparisons to distinguish:
fixed-installation measurement repeatability
from:
installation / interface variability
The objective is not to classify every remount difference as platform error.
It is to identify whether the interface or installation state itself is materially influencing the thermal result.
Thermal-Fluid Subsystem
When the engineering question sits on the fluid side, a compact thermal-fluid subsystem can be placed within the test boundary.
That may include combinations of:
- flow-control hardware;
- pumps;
- valves;
- sensing elements;
- other cooling-loop components.
The objective is not simply to confirm that an individual component operates.
It is to observe how the subsystem changes:
- flow rate;
- pressure drop;
- temperature response;
- system-level thermal behavior.
Representative Thermal Load
A real DUT may be unavailable, too costly, or unsuitable for repeated testing.
In those cases, a controlled representative heat source can establish a known:
- input power;
- source / contact area;
- interface condition.
Cooling hardware, interfaces, or subsystems can then be compared against a common physical baseline.
The representative load is not presented as a substitute for the final device.
Its purpose is to create a controlled and repeatable test boundary.
Future multi-zone or hotspot-representative capability should remain labeled Future, Planned, or Under Development until formally released.
3. What Is Controlled, Defined, and Measured?
Validation should not begin by attaching every available sensor.
The first distinction is:
Which conditions are intentionally defined or controlled, and which quantities are physical responses measured from the test?
Conditions intentionally imposed
- Applied thermal load
- Project-defined operating condition
- Coolant inlet condition
- Flow condition
- Mounting / interface condition
- Fixture geometry / test boundary
Physical response recorded
- Temperature
- Flow
- Pressure drop
- Electrical power
- Clamp force, where applicable
- Steady-state response
- Transient response, within released sampling capability
4. Multi-Channel Acquisition|Not Just the Final Steady-State Number
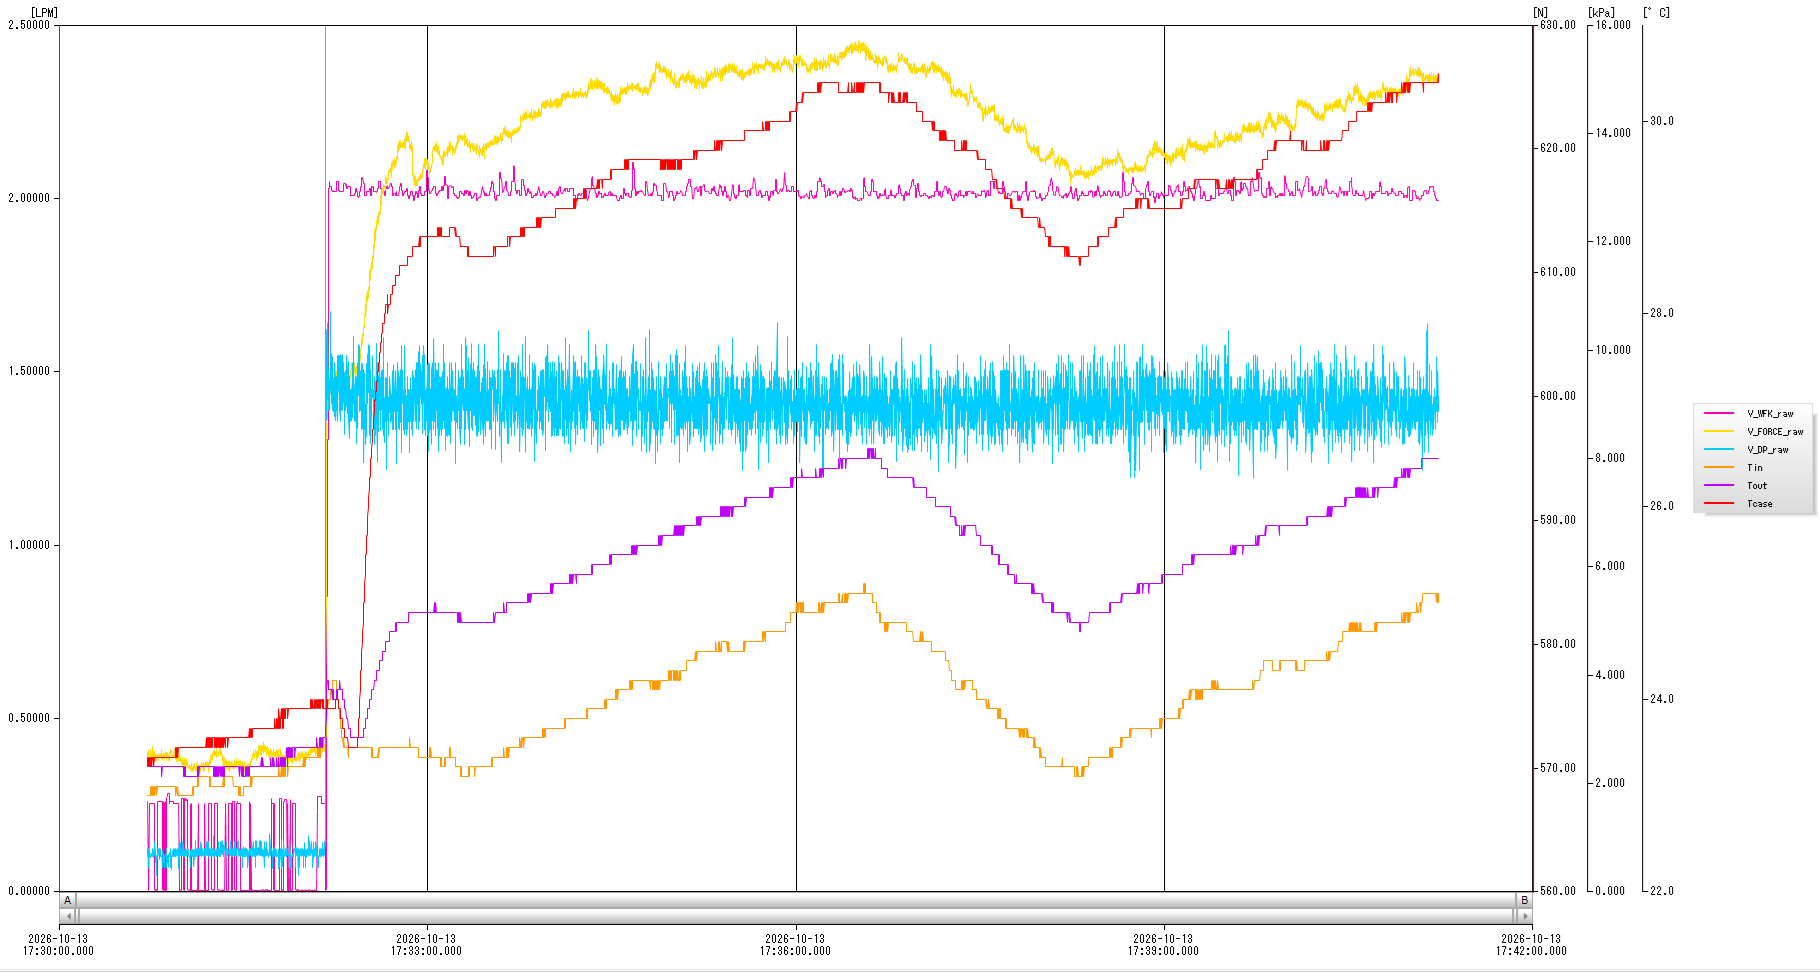
P-001 uses a data logger to record the following channels at 0.1 s intervals:
- Tin
- Tout
- Tcase
- Flow
- ΔP
- Clamp / Load
A formal heated campaign therefore preserves more than the final steady-state result.
The time history can be reviewed for:
- warm-up and stabilization;
- temperature response;
- flow / pressure response;
- clamp drift / creep;
- operating-point transitions;
- abnormal events;
- reference-point return behavior.
Heater V/I is logged separately from the power supply (PSW) through the PC with retained timestamps.
Formal steady-state analysis aligns the data logger and PSW data streams through a timestamp-based common averaging window.
P-001 v0.1 does not claim sample-level hardware synchronization between the PSW and MCR, and does not use the current architecture to claim sub-second electrical-to-thermal delay measurement.
Not just the final steady-state number
During a formal heated campaign, the MCR data logger records thermal, hydraulic, and mechanical responses at 0.1 s intervals.
5.What Engineering Decisions Can P-001 Support?
The value of P-001 is not the number of channels it can record.
It is whether the resulting evidence can reduce uncertainty in the next engineering decision.
Is thermal performance sufficient?
- Temperature
- Temperature rise
- Project-defined comparative thermal resistance
- Response versus power / flow
Is more flow still worth it?
- Thermal improvement
- Pressure-drop increase
- Reference-point return check
Is the interface changing the result?
- Clamp record
- TIM / seating condition
- Same-mount repeatability
- Independent remount variation
Is the result stable enough to support a decision?
- Same-mount repeatability
- Continuous time-history
- Stabilization
- Drift
- Reference-point return
Can two configurations be compared fairly?
- Same or sufficiently matched power
- Coolant
- Flow
- Clamp
- Installation ID
- Measurement chain
Which option should move forward?
- Baseline
- A/B result
- Simulation prediction versus measurement
- Stated limitations
- Decision Record
6. How HCL Structures a Validation Problem
Start with the decision, not the instrument list.
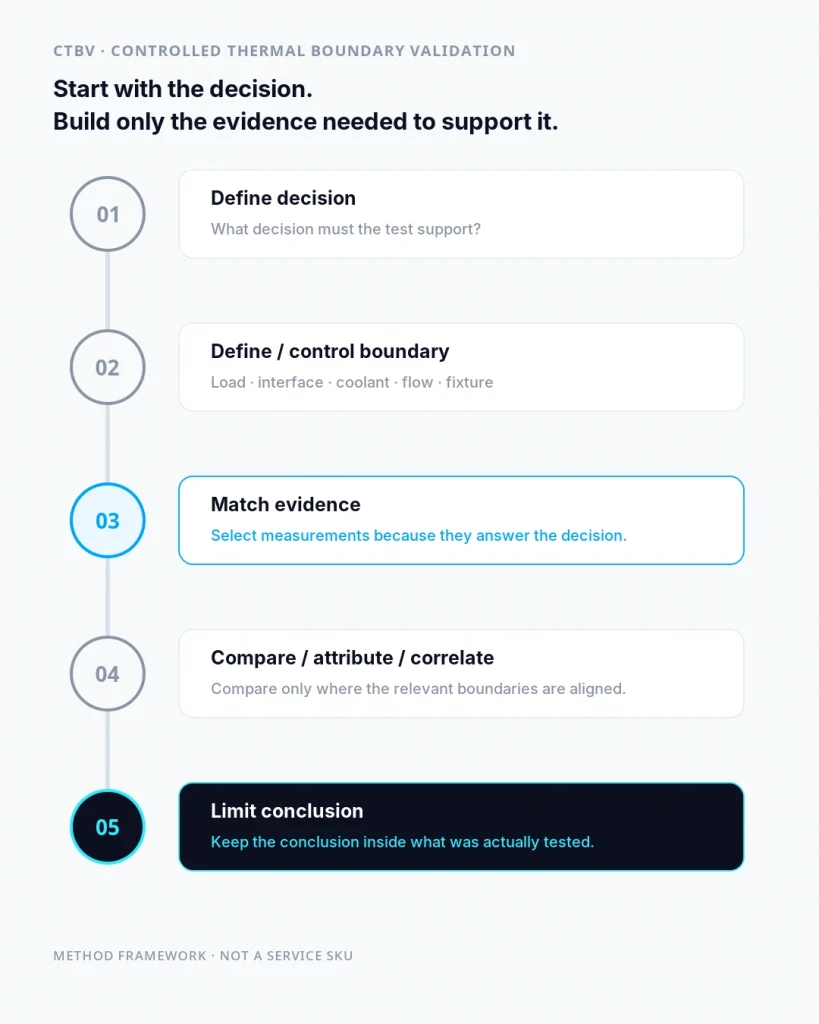
Hyper Cool Lab uses Controlled Thermal Boundary Validation (CTBV) as a working framework for structuring a validation problem.
It is a methodology, not another service SKU.
Define decision → Define / control boundary → Match evidence → Compare / attribute / correlate → Limit conclusion
The first step is not to decide which sensors are available.
It is to define:
What decision must this test support?
Then determine:
- which boundaries must remain controlled;
- which conditions may be intentionally changed;
- which physical responses must be measured;
- which evidence is sufficient for the next gate.
Comparison may involve:
- a baseline;
- another physical configuration;
- a simulation prediction;
but only where the experimental and modeled conditions are sufficiently aligned for the comparison to be meaningful.
The final step is equally important:
The conclusion remains limited to the conditions that were actually established, measured, and recorded.
If electrical, optical, RF, firmware, silicon, or other functional metrics are required, those measurements may remain customer-owned or be handled by the appropriate specialist.
7. Measurement Credibility|Formal Measurement Release
P-001 v0.1 has completed Formal Measurement Release.
The capability disclosed here is based on heated platform-level measurement evidence—not on sensor datasheets, component ratings, or expected design values.
The credibility work was designed to answer three different questions:
- If the installation does not change, can the measurement repeat itself?
- If the DUT is removed and installed again, how much can the installation boundary itself change the result?
- After the operating condition is changed through a full test matrix, can the original reference point be recovered?
These are different questions and should not be collapsed into one generic “platform accuracy” number.
If the installation does not change, can the measurement repeat itself?
To judge whether a validation platform is useful for comparative work, the first question is not:
“Does the sensor datasheet look accurate?”
The more relevant question is:
“If the DUT, TIM, seating, and mounting remain unchanged, does repeating the same operating point produce essentially the same result?”
HCL therefore kept the same:
- DUT;
- TIM;
- seating;
- mounting boundary;
and repeated the same heated operating point without disassembling the test article.
The same-mount campaign completed n=3 repeated measurements.
The three comparative Rθ_case,elec results were closely grouped, producing:
Rθ CV ≈ 0.42%
What does this support?
It supports the following statement:
With the installation boundary held fixed, P-001 demonstrates run-to-run measurement repeatability suitable for same-boundary comparative validation.
In practical terms, if a subsequent test changes:
- flow;
- power;
- coolant condition;
- or another intentionally controlled operating parameter;
and the resulting change is materially larger than the same-mount scatter, there is stronger evidence that the change reflects the DUT / operating response rather than random run-to-run measurement drift.
What does 0.42% not mean?
It does not mean:
P-001 absolute accuracy = 0.42%.
It also does not mean:
Every DUT, every remount, and every installation will vary by only 0.42%.
The 0.42% figure describes:
same-mount Rθ repeatability for this fixed DUT / TIM / seating / mounting boundary.
That is why HCL separately performed independent remount testing.
The same-mount test asks about:
measurement repeatability
while the remount test asks about:
installation / interface variability
Those two effects should not be combined into one generic platform-error number.
What changes when the DUT is removed and installed again?
The same-mount test deliberately leaves the DUT, TIM, seating, and mounting state untouched.
Independent remount testing asks a different question:
What happens when the physical installation boundary itself is rebuilt?
For this test, HCL removed the DUT and then repeated:
- interface cleaning;
- TIM re-application;
- DUT seating;
- clamp reset;
before returning to the same nominal operating condition.
Across the independent installations, HCL used the same DUT and maintained the same nominal:
- electrical input condition;
- coolant condition;
- flow condition;
- clamp target.
The load cell also records the clamp boundary, so the comparison is not being made with an unknown total clamp load.
However, the resulting thermal values still showed materially more variation than the fixed-installation same-mount scatter.
What does this mean?
It does not mean:
“P-001 becomes inaccurate after a remount.”
It means:
The thermal result is sensitive to the DUT–TIM–seating–mounting installation boundary itself.
Even when nominal clamp, flow, electrical input, and coolant condition are held consistent, re-applying TIM and rebuilding the physical interface can change:
- local contact condition;
- TIM distribution;
- seating state;
- microscopic interface behavior.
The load cell makes the total clamp boundary traceable, but it does not prove that local pressure distribution, bond-line thickness, or microscopic contact are identical after every installation.
HCL therefore treats two effects separately:
Measurement repeatability
How stable is the result when the installation is left unchanged?
and:
Installation variability
How much can the thermal result change when DUT / TIM / seating / mounting are rebuilt?
Why does this matter?
Suppose two cold-plate configurations differ by only a few percent, but the test requires a remount between them.
That difference cannot automatically be attributed to the cold-plate design alone.
The experiment has also introduced a new installation boundary.
P-001 therefore helps the team ask:
Is the observed difference more consistent with measurement scatter, or with installation / interface variation?
The current evidence shows that:
fixed-installation measurement scatter is materially smaller than independent-installation variation.
For small cross-DUT or cross-remount differences, the validation method therefore needs to be designed around the actual decision threshold—for example through repeated installations or tighter interface-control methods.
After changing operating conditions, can the original reference point be recovered?
A useful comparative campaign needs more than same-point repeatability.
If flow is changed through a full test matrix, the team also needs to know whether the setup remains sufficiently stable over the campaign.
HCL therefore completed, under the same DUT / TIM installation:
~1 L/min → ~2 L/min → ~3 L/min
and then returned to approximately:
2 L/min
as the reference condition.
The first ~2 L/min point measured:
Rθ_case,elec ≈ 0.026989 K/W
After the full matrix, the ~2 L/min return point measured:
Rθ_case,elec ≈ 0.026984 K/W
The difference was approximately:
−0.02%
What does this mean?
It does not mean:
P-001 absolute accuracy = 0.02%.
What it supports is:
Within this complete test campaign, the original reference condition was recovered to nearly the same comparative thermal result after the flow matrix was completed.
That matters because it strengthens the interpretation that the differences observed at ~1, ~2, and ~3 L/min were associated with the intentionally changed flow condition—not simply with:
- progressive test-setup drift;
- a materially changing installation state;
- or loss of campaign stability.
That is the purpose of a reference-point return check.
What the three credibility checks mean together
Three different questions, three different checks
Repeatability, installation variability, and same-campaign stability are kept separate rather than collapsed into one generic “accuracy” number.
Does the measurement repeat?
Same-mount run-to-run repeatability under a fixed DUT / TIM / seating / mounting boundary.
Can the interface itself change the result?
Independent-installation variation is materially larger than same-mount scatter and is treated as installation / interface variability, not automatically as platform error.
Does the reference point come back?
The 2 L/min reference point returned to nearly the same comparative thermal result after the full flow matrix.
Key statement
The value of P-001 is not simply that “the number repeats.” It is that the validation method separates three different sources of change: measurement repeatability, installation / interface variability, and the engineering response created by an intentionally changed operating condition.
That distinction makes it easier to ask:
Is the observed difference real enough—and understood well enough—to support the next engineering decision?
8. P-001 v0.1|Released Boundary
P-001 v0.1 Released Boundary
- Platform status
- Formal Measurement Release completed
- Heated power
- ≤200 W class
- Flow
- 1–3 L/min
- Coolant
- Pure RO water · 25°C nominal
- Clamp boundary
- 600 N nominal
- Same-mount repeatability
- Rθ CV ≈ 0.42%
- MCR recording
- 0.1 s multi-channel time-history
- Validation class
- Engineering Validation under Stated Conditions
Formal comparative metric: Rθcase,elec. Same-boundary comparative validation is the primary v0.1 use case. Conditions outside the released boundary require project-specific qualification.
9. First Decision Evidence|Is More Flow Still Worth It?
The purpose of P-001 is not simply to produce a thermal-resistance number.
A useful validation campaign should place the thermal gain and the engineering cost of achieving that gain inside the same controlled evidence set.
Using an HCL reference cold plate, HCL kept the same DUT, TIM, and mounting installation while maintaining approximately:
- 200 W electrical input
- 25°C nominal coolant condition
- 600 N nominal clamp
The platform then measured approximately:
1 → 2 → 3 L/min
and finally returned to approximately:
2 L/min
as a reference-point check.
The engineering question was straightforward:
Once flow has already been increased, is the next increment of flow still worth the hydraulic cost required to obtain the additional thermal benefit?
Is More Flow Still Worth It?
HCL reference cold plate|same installation|~200 W electrical input|25°C nominal coolant|600 N nominal clamp
What did the measurements show?
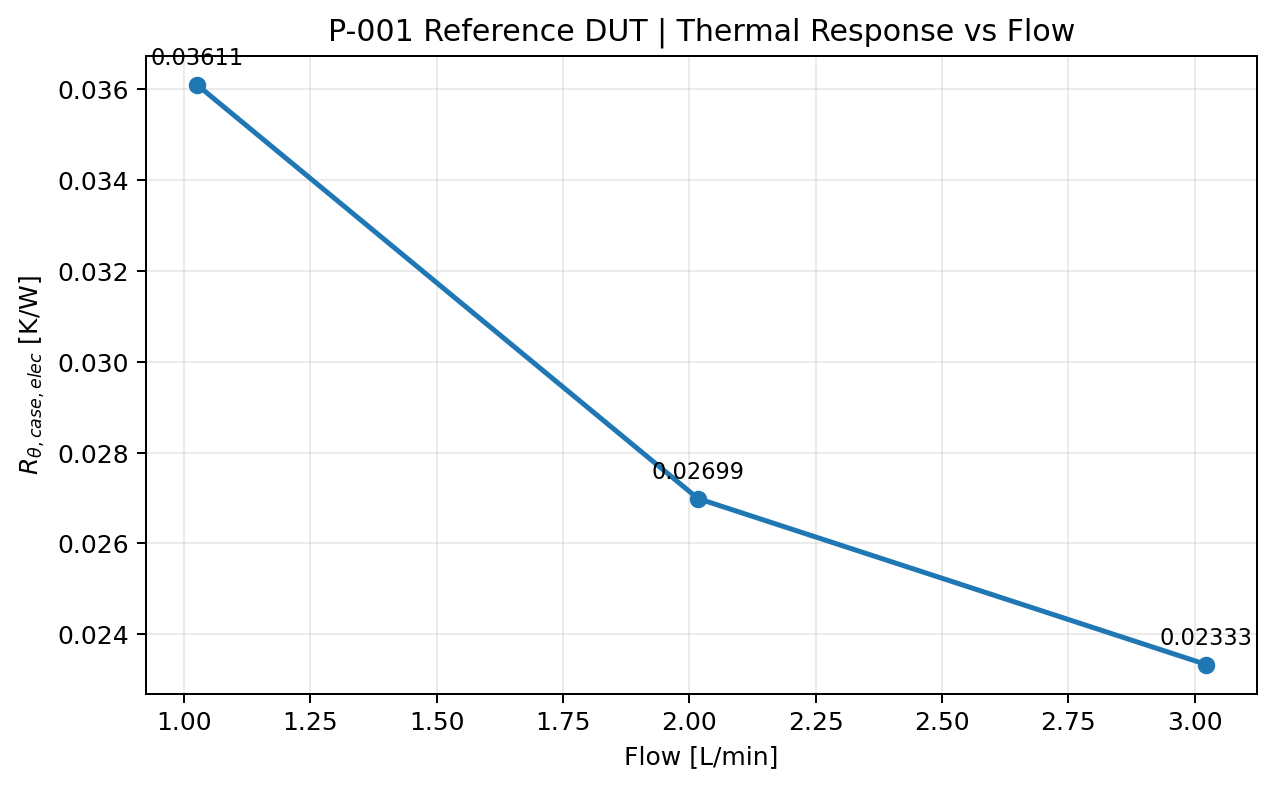
From approximately 1 → 2 L/min, the reference cold plate’s comparative thermal resistance changed from approximately:
0.0361 K/W → 0.0270 K/W
a reduction of about:
25.3%
In this range, increasing flow produced a substantial thermal benefit.
When flow increased again from approximately 2 → 3 L/min, comparative thermal resistance continued to improve:
0.0270 K/W → 0.0233 K/W
or a further reduction of about:
13.5%
So 3 L/min was not thermally ineffective.
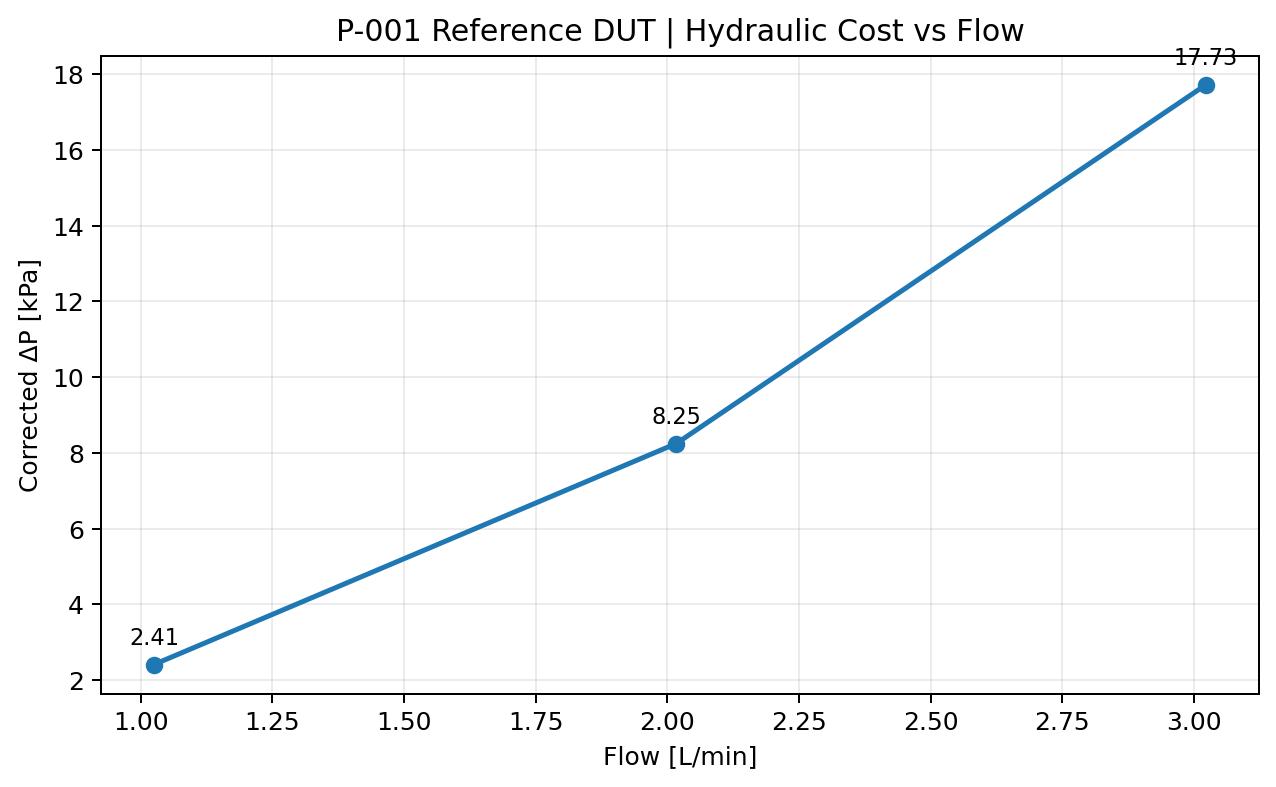
The trade-off appears on the hydraulic side.
Across the same 2 → 3 L/min step, corrected pressure drop increased from approximately:
8.25 kPa → 17.73 kPa
or to approximately:
2.15×
the 2 L/min value.
In other words:
Thermal performance continued to improve, but the hydraulic cost required for each additional increment of thermal benefit increased substantially.
How do we know the campaign itself did not simply drift?
After completing the approximately 1 / 2 / 3 L/min flow matrix, P-001 returned to the original approximately 2 L/min reference condition.
The first ~2 L/min point measured:
Rθ_case,elec ≈ 0.026989 K/W
The return point measured:
Rθ_case,elec ≈ 0.026984 K/W
The difference was approximately:
−0.02%
The purpose of this check is not to claim:
“P-001 absolute accuracy = 0.02%.”
It is to show that:
Within this campaign, the reference condition returned to nearly the same comparative thermal result after the flow matrix was completed.
That makes it more credible to interpret the differences observed between the 1 / 2 / 3 L/min points as an engineering response to the intentionally changed flow condition, rather than as progressive drift of the test setup.
DR-001|What decision does this evidence support?
DR-001|Flow–Thermal Trade-off
For this HCL reference cold plate under the stated conditions:
Increasing flow to 3 L/min still improves thermal performance. Therefore, 3 L/min is not an ineffective operating point.
However, compared with the 1 → 2 L/min step, the additional thermal benefit from 2 → 3 L/min is smaller while the pressure-drop penalty becomes substantially larger.
The next decision should therefore consider more than whether temperature continues to decrease. It should consider:
- thermal benefit
- pressure drop
- pump requirement
- system-level hydraulic cost
Boundary statement after the Decision Record
This does not mean:
“2 L/min is the universal optimum for all cold plates.”
The Decision Record applies only to:
this reference DUT, this installation, and the stated conditions that were actually established and measured.
A different cold plate, channel geometry, coolant, or system boundary can produce a different trade-off.
The value of P-001 is not to tell a team that “more flow makes it cooler.” It is to put thermal gain, hydraulic penalty, and campaign stability into the same evidence set so the team can judge whether increasing flow is still worth it.
10. Platform Scope and Limits
Clearly defining what the evidence does not support is part of Engineering Validation.
P-001 v0.1 currently has a formal released boundary of:
- 1–3 L/min
- Pure RO water
- 25°C nominal coolant
- 600 N nominal clamp
- 50 × 50 mm nominal contact area
Its primary current use is:
same-boundary / fixed-installation comparative validation
Engineering Validation is not accredited calibration or certification
Hyper Cool Lab provides:
- measurement evidence;
- engineering interpretation;
- bounded Decision Records;
under clearly stated engineering conditions.
P-001 v0.1 does not claim:
- accredited calibration;
- certification;
- JEDEC qualification;
- production sign-off;
- intrinsic cold-plate-only Rth;
- calibration-grade absolute low-flow ΔP;
- 0.42% repeatability across independent remounts;
- formally released >3 L/min capability;
- formally released two-phase validation;
- formally released multi-zone validation;
- formally released high-speed transient validation.
Projects requiring formal regulatory, accreditation, or third-party certification results still require the appropriate organization.
Thermal evidence is not complete product root-cause analysis
If the relevant problem also depends on:
- electrical;
- optical;
- RF;
- firmware;
- silicon;
- other functional metrics;
those data need to be interpreted together with the thermal evidence.
P-001 can help determine whether evidence is consistent with a limitation in:
- interface;
- flow;
- cooling capacity;
- test boundary.
Thermal-fluid measurement alone is not used to claim that the complete product root cause has been established.
Conclusions remain bounded by the conditions actually tested
HCL limits interpretation to the conditions that were actually:
- established;
- measured;
- recorded.
A result measured at one:
- power;
- flow;
- mounting condition;
- interface;
- coolant condition;
- operating condition;
cannot automatically be extended beyond those conditions.
This does not make the evidence weaker. It makes clear what engineering decision the evidence can legitimately support.
11. Technical Clarifications
Q1|Is P-001 just a cold-plate test bench?
No.
A cold plate can be one test article, but P-001 is structured around the engineering question.
The platform establishes a defined:
- thermal load;
- contact / mounting boundary;
- cooling condition;
- measurement chain;
and creates physical evidence for the next engineering decision.
Q2|Can P-001 determine the complete product root cause?
Not from thermal-fluid evidence alone.
P-001 can help determine whether the measured behavior is consistent with limitations associated with:
- interface;
- flow;
- cooling capacity;
- test condition.
If the problem also depends on electrical, optical, RF, firmware, silicon, or other functional behavior, those data still need to be interpreted together.
Q3|Why record continuous time-history data instead of only the final steady-state temperature?
A single steady-state number does not show:
- warm-up;
- settling;
- drift;
- operating-point transitions;
- reference return behavior.
P-001’s MCR group currently records Tin, Tout, Tcase, Flow, ΔP, and Clamp / Load at 0.1 s intervals.
Heater V/I is logged separately from the PSW.
Formal steady-state evidence is aligned through a timestamp-based common averaging window.
P-001 v0.1 does not claim sample-level hardware synchronization between the PSW and MCR.
Q4|What is formally released in P-001 v0.1?
The current formal released boundary is:
- 1–3 L/min
- Pure RO water
- 25°C nominal
- 600 N nominal clamp
The primary use is:
same-boundary / fixed-installation comparative validation
A condition is not treated as a formal released capability simply because the hardware may theoretically reach it.
Conditions outside the released boundary require project-specific qualification.
Q5|Does the 0.42% figure mean P-001 has 0.42% accuracy?
No.
0.42% is the same-mount Rθ repeatability CV observed for the HCL reference setup with the same:
- DUT;
- TIM;
- seating;
- mounting boundary.
It describes run-to-run repeatability under a fixed installation.
It does not mean:
- absolute accuracy = 0.42%;
- independent-remount variation = 0.42%;
- every DUT will show the same scatter.
Q6|Why is independent-remount variation larger than same-mount variation?
Because remounting creates a new installation state.
That can change:
- TIM distribution;
- seating;
- contact condition;
- local interface behavior.
The load cell records the total clamp boundary, but it does not prove identical local pressure distribution or bond-line thickness after every installation.
That is why P-001 treats:
measurement repeatability
and:
installation / interface variability
as separate engineering effects.
Do You Have a Prototype That Needs Evidence Before the Next Gate?
If you already have a prototype, fixture, cooling assembly, or thermal-fluid subsystem—and the next step involves design changes, integration, supplier comparison, sample delivery, or a customer gate—start with the decision the evidence needs to support.
See What P001 Can Help You DecidePrepare:
- the hardware or subsystem;
- its development stage;
- known thermal loads and boundary conditions;
- interface constraints;
- existing measurement or simulation evidence;
- the next engineering or customer decision;
- the largest remaining uncertainty.
Discuss a Validation Need
Bring the decision you need to make, the physical boundary you already know, and the evidence you already have. Hyper Cool Lab will use the initial intake to assess fit, scope, material evidence gaps, and an appropriate next validation step.
Initial intake does not provide a free cooling architecture, complete root-cause analysis, guaranteed wattage capability, certification, or production sign-off.